Charting
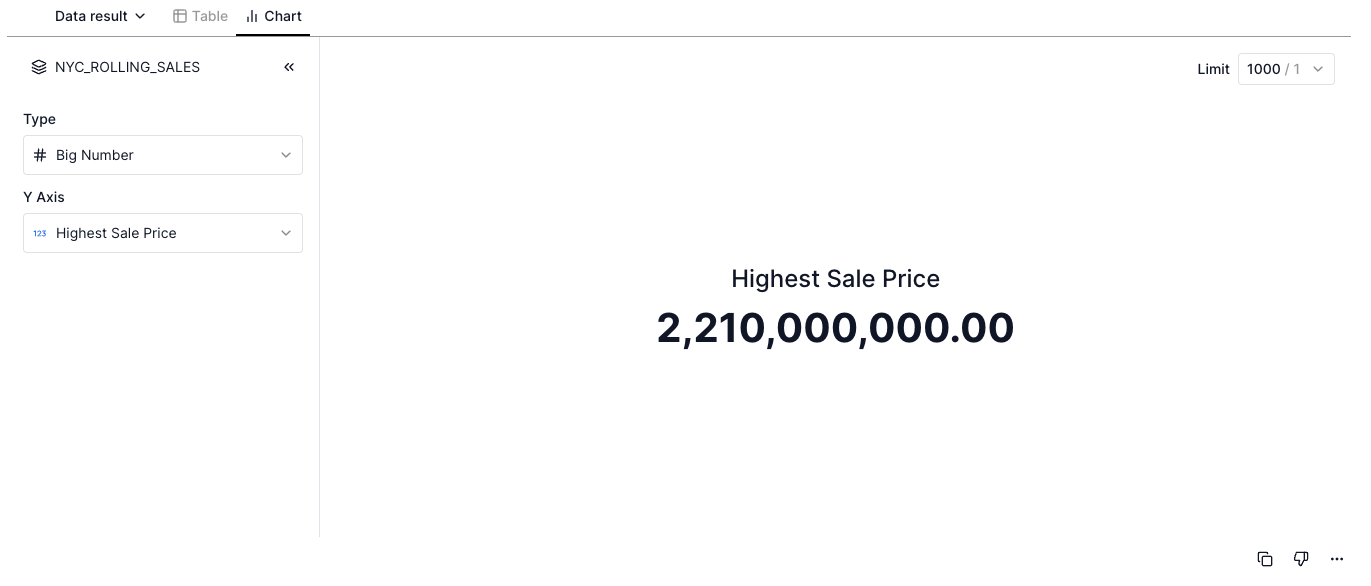
When inspecting the result of a data query, the default output is a table. However, choosing the Chart view allows you to plot the data table returned interactively.
There are four types of supported charts: Bar, Line, Scatter, and Big Number. For every chart, you can choose specified dimensions or metrics for each axis, and an interactive plot will be generated where the scales can be modified, and the data points can be inspected.


