Key Concepts
This page explains some key concepts around the Numbers Station platform to help you understand how to think about the product.
Analytics Co-Pilot and Agents
When a user asks a question, the Analytics Co-Pilot generates responses using a network of specialized agents.
The agents include:
- Search Agent: Finds relevant datasets and dashboards.
- Query Agent: Formulate and execute data warehouse queries to retrieve information.
- Charting Agent: Creates visual representations like charts.
- Clarification Agent: Asks follow-up questions to refine user queries.
- Review Agent: Reflects on the response to understand the results and reviews correctness especially when the response is empty, null or 0.
- Planner Agent: Breaks down tasks and assigns them to the appropriate agents.
By coordinating these agents, the platform delivers accurate and insightful answers to user queries.
Chat
A Chat is a thread of messages exchanged between the user and the Analytics Co-Pilot. These messages include user questions and system responses, which may consist of tables, charts, explanations, or clarifying questions.
Key characteristics of chats:
- Contextual Awareness: The Analytics Co-Pilot considers all messages within the same chat as context for generating responses.
- Isolation of Chats: Each chat is independent; context is not shared between chats. Every new chat begins with a clean slate.
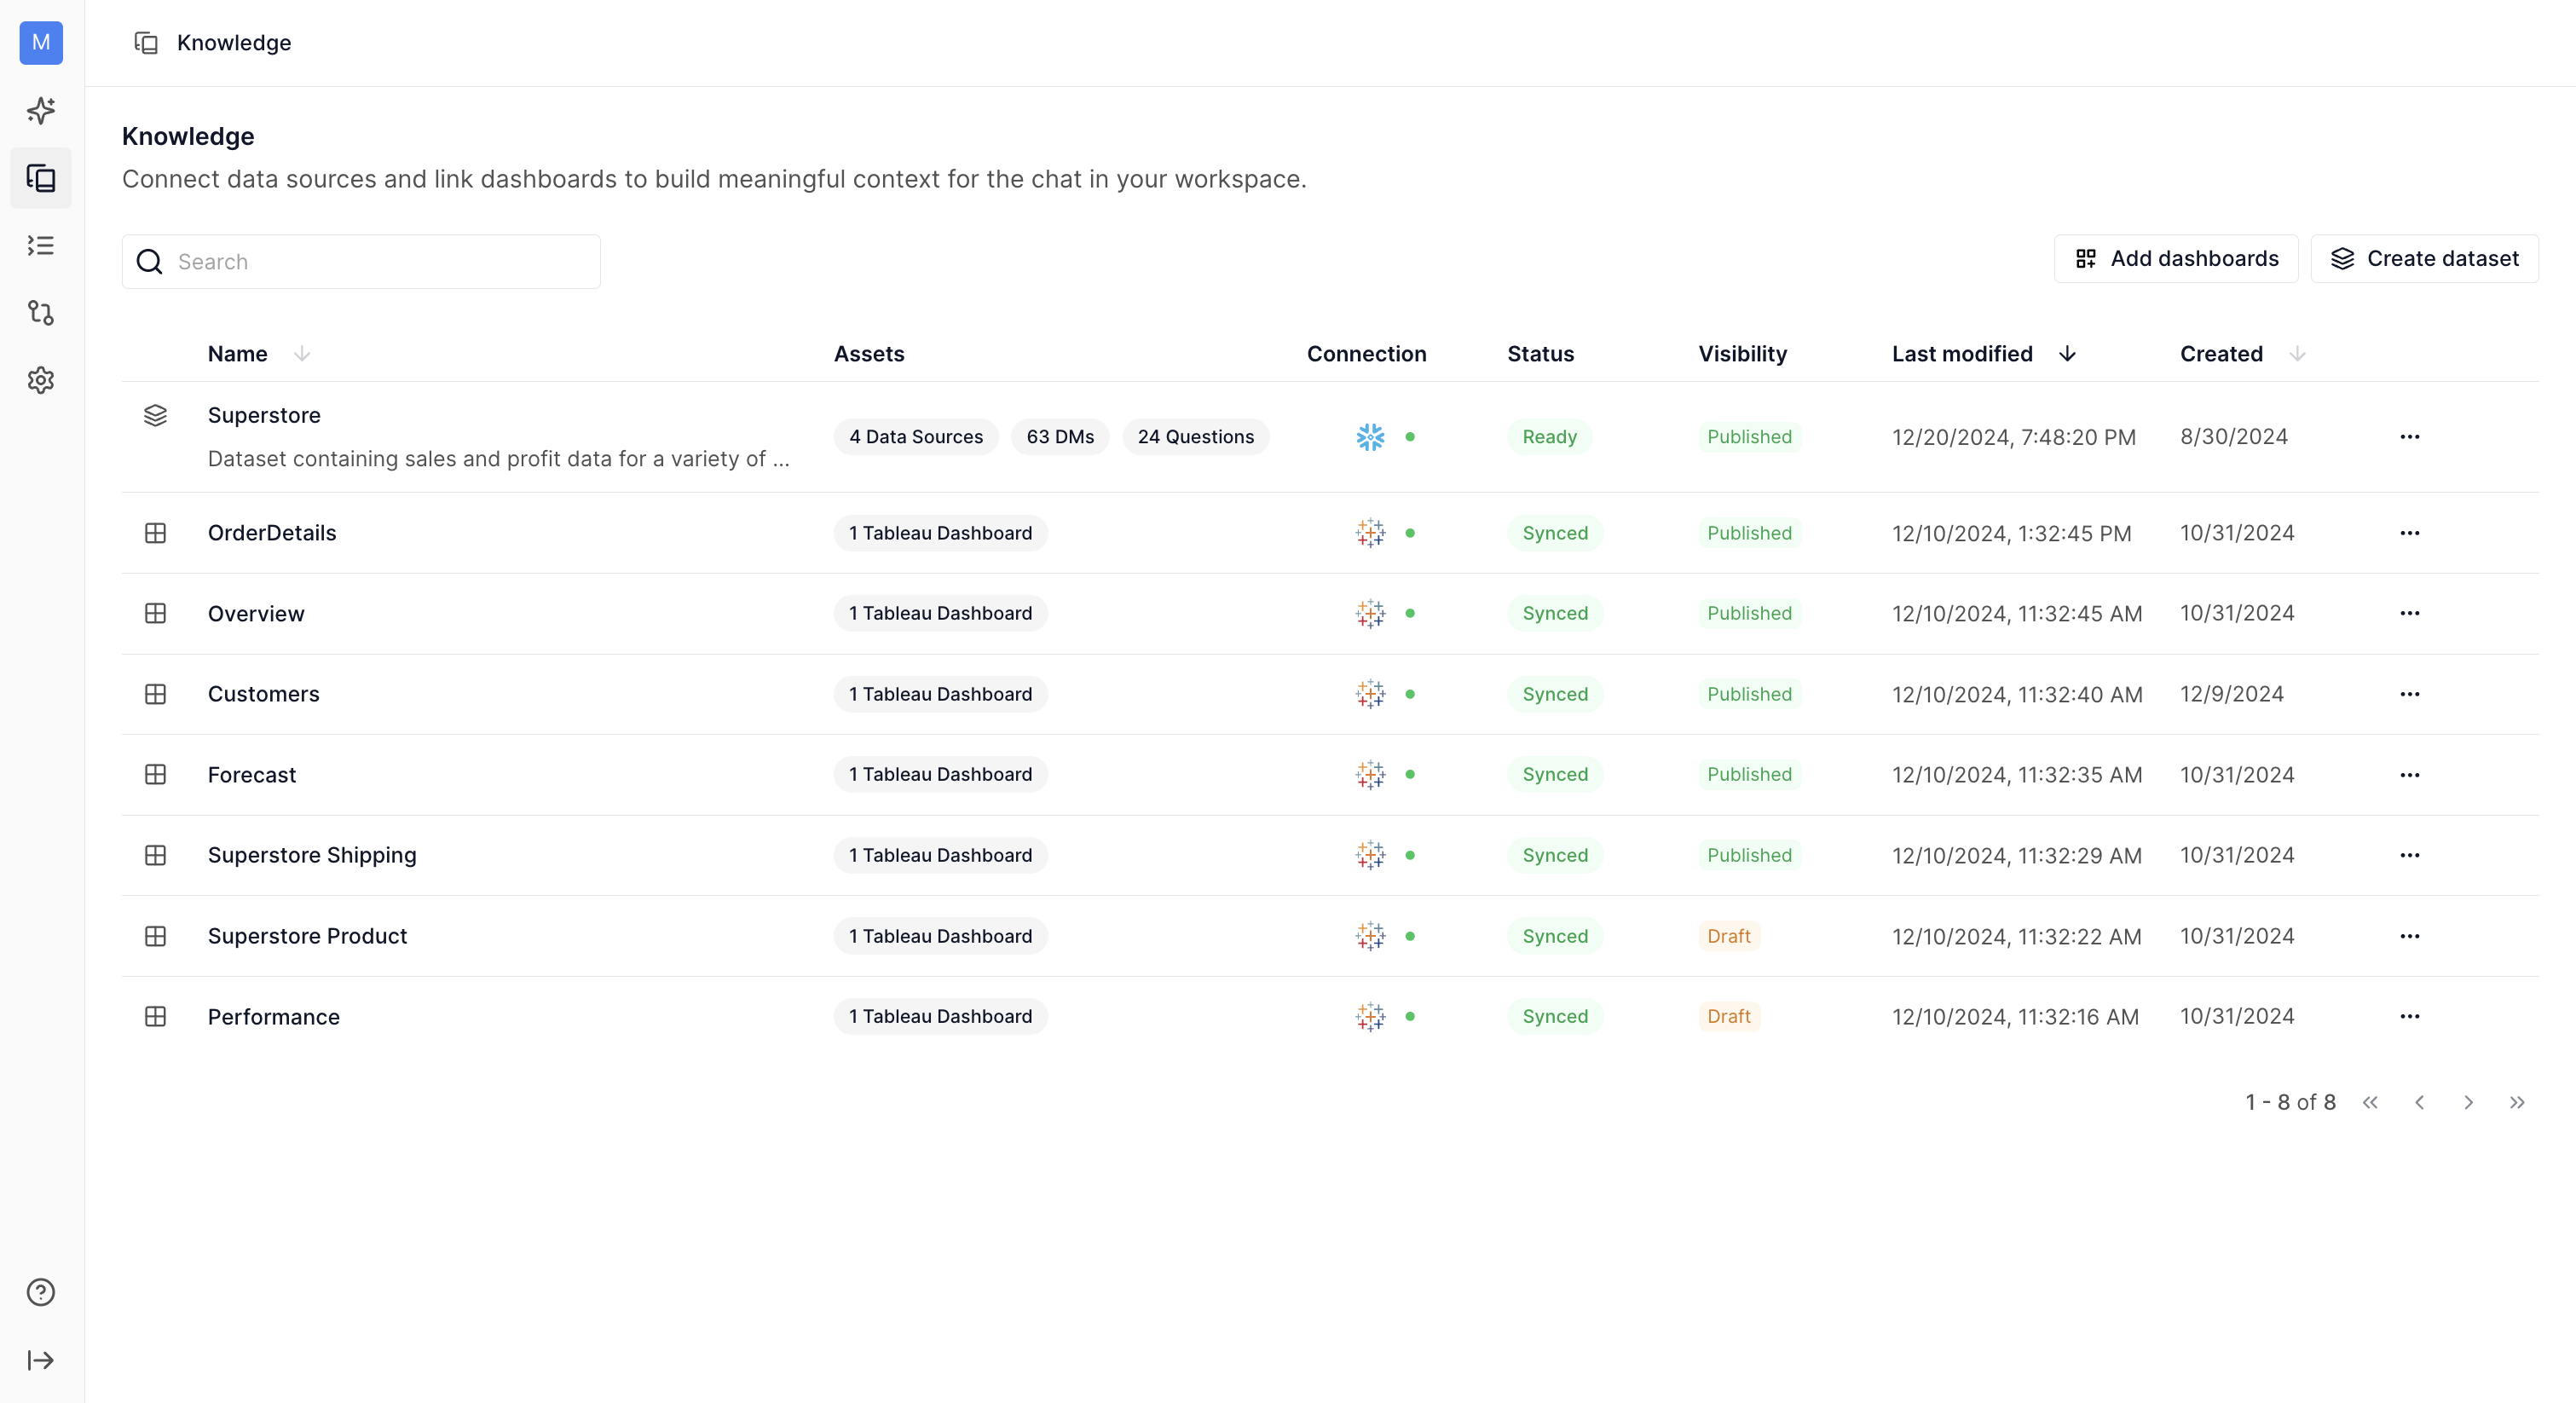
Knowledge
Knowledge refers to the collection of datasets, dashboards, and other data assets that the system can use to answer user questions. This layer is essential for understanding business logic and semantics to provide accurate and relevant answers.
The knowledge layer is maintained by Numbers Station with input and feedback from data administrators.
Datasets
A dataset is a collection of tables that all answer questions from one domain. For optimal performance, tables in a dataset should follow a snowflake schema
Datasets are essential knowledge entities that the system references when responding to user queries.
Dashboard
A Dashboard is a collection of views and charts created by data analysts using tools like Tableau, Mode, or Power BI. These dashboards serve as visual summaries of key metrics and insights.
Dashboards are also knowledge entities that the system can use to answer user questions.
Dimensions
Dimensions are categorical attributes that describe and organize the data in your datasets and dashboards. They also define relationships between knowledge entities such as datasets and dashboards.
Examples include:
- Time periods
- Geographic locations
- Product categories
Dimensions enable users to segment and analyze data in detail. In the platform, dimensions are used to "slice" data for more granular analysis. Access all dimensions and their details through the Dimensions section in the dataset catalog view.
Metrics
Metrics are quantitative measurements used to evaluate the performance or progress of specific business activities. They provide insights into trends and patterns within a dataset or dashboard.
Examples include:
- Sales figures
- Conversion rates
- Average order values
Metrics in Numbers Station are calculated and presented to help users make informed decisions. Access all metrics and their details via the Metrics section in the dataset catalog view.
Filters
Filters refine and narrow data analysis by including or excluding specific data points based on criteria such as time frames, geographic areas, or product categories.
Benefits of filters:
- Focus on relevant subsets of data.
- Perform targeted analyses.
- Enhance the precision and relevance of insights.
Access all filters and their details in the Filters section of the dataset catalog view. In the dataset catalog view, clicking on Filters allows you to access all filters and their relevant information.
