Organize with the Knowledge Layer
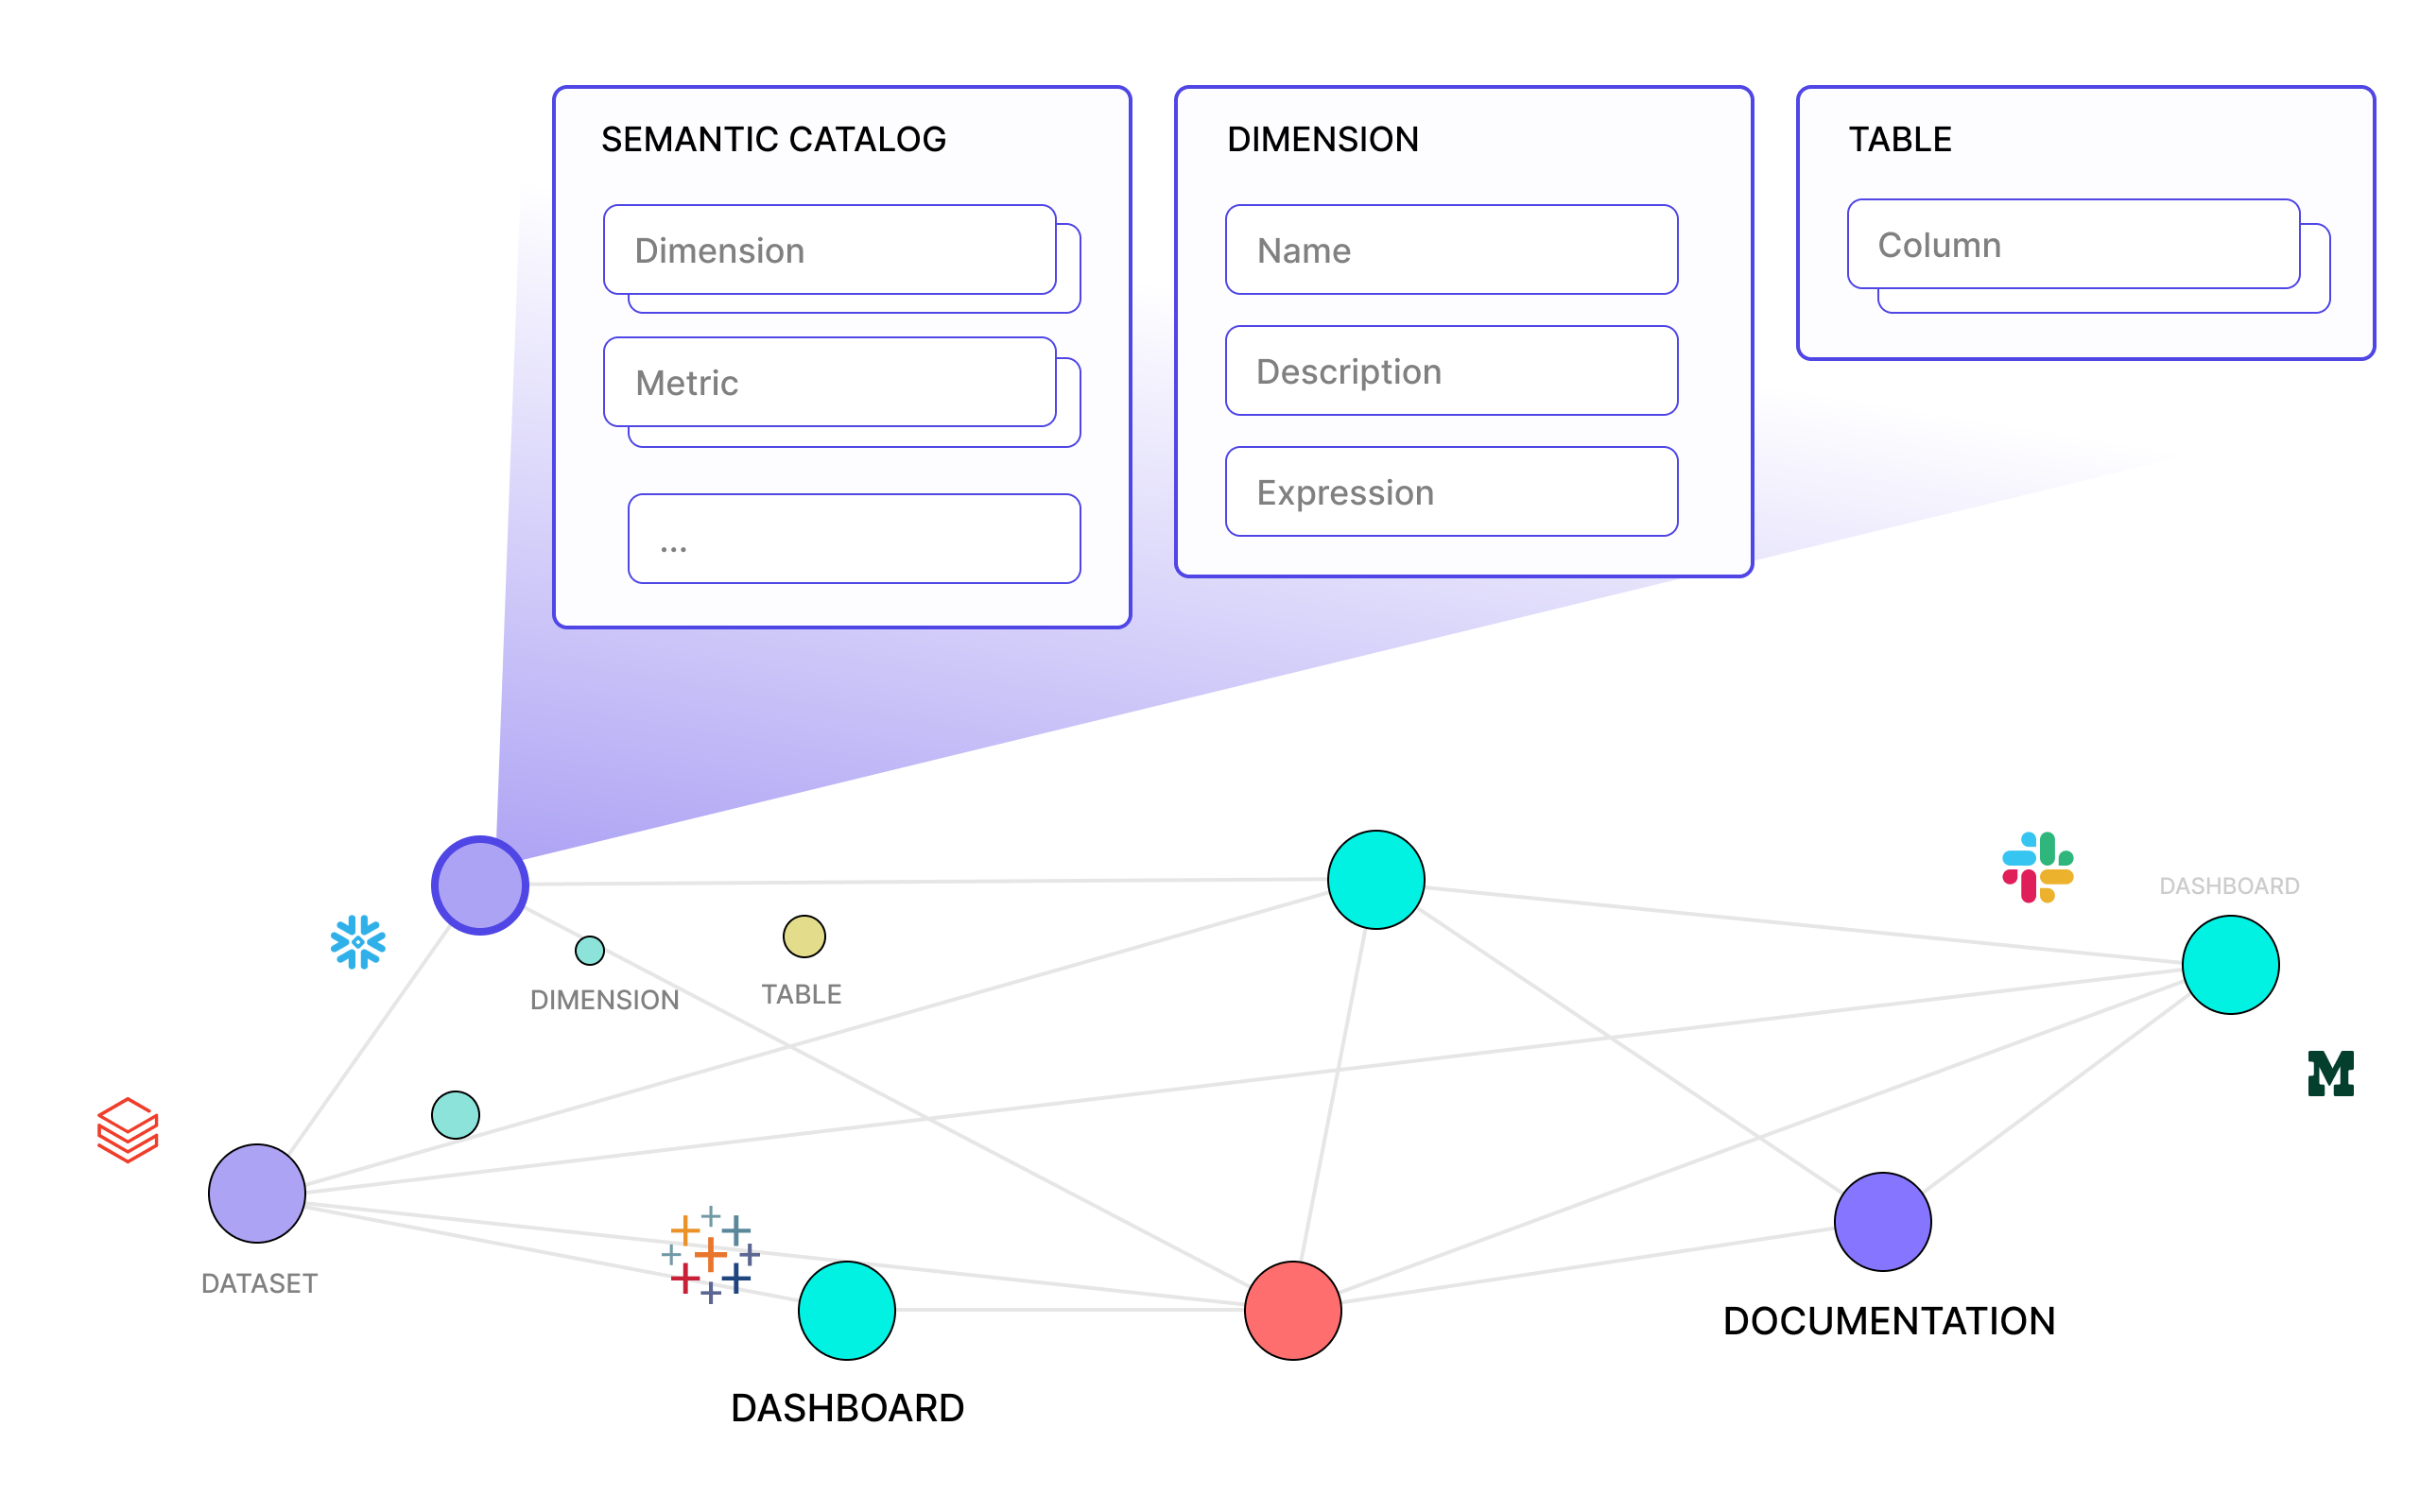
After establishing data connectivity and unifying your analytics ecosystem, Numbers Station provides a structured environment to store and manage the context of your data. This is achieved through the Knowledge Layer, which functions as a combination of a knowledge graph and an AI-powered semantic layer. Its purpose is to represent, connect, and maintain detailed metadata about all analytics assets—dashboards, datasets, metrics, transformations, and related artifacts—in a manner that is both machine-readable and human-auditable.
Representing Entities as Knowledge Nodes
Each analytics artifact is stored as an entity (a "node") within the Knowledge Layer.
- Dashboards: Beyond holding references to their underlying queries, each dashboard node stores natural language descriptions of its metrics, searchable indexes of its content, and associated visual images. These images are processed with computer vision and embedding techniques, allowing the system to inspect, index, and retrieve them based on visual features or textual queries.
- Datasets and Star Schemas: Dataset nodes represent logical groupings of tables and relationships (e.g., fact and dimension tables in a star schema). The node stores details about table joins, column-level metadata, and historical queries that have referenced these tables. Natural language descriptions of columns, along with contextual business logic, further enrich the dataset node, making it function like an AI-enabled semantic layer. For example, a dataset node may store that a "customer_id" column joins to a "customers" dimension and that "total_sales" is a metric representing the sum of the "sales_amount" column.
Capturing Relationships as Edges
The Knowledge Layer links these nodes together with directed edges that describe meaningful relationships. Examples include:
- Dashboard-to-Dataset Links: If a dashboard is built on a specific dataset, an edge connects the dashboard node to the dataset node.
- Table-to-Table Joins: Star schemas are represented as edges between fact and dimension tables, capturing how data should be combined.
- Metric-to-Column Mappings: Edges can detail how a metric is derived from one or more columns, preserving the lineage and logic behind each calculation.
By navigating these relationships, the system can identify where a given metric originates, how a dashboard obtains its data, and how different datasets interrelate. This network of nodes and edges transforms raw metadata into a structured, queryable representation of institutional knowledge.
Augmenting with Human Input
While the system leverages AI models to infer relationships, generate descriptions, and annotate visual content, human experts provide necessary review and refinement. Numbers Station offers an administrative interface that allows authorized users to:
- Edit Entities: Adjust or add natural language descriptions, rename nodes, or update metadata.
- Revise Relationships: Correct or refine how datasets, dashboards, and metrics are linked, ensuring accuracy in data lineage.
- Refine Business Semantics: Insert domain-specific logic, clarify ambiguous terms, and confirm that derived metrics align with organizational definitions.
This human-in-the-loop approach ensures the Knowledge Layer reflects both machine-inferred structure and the organization's domain expertise. Over time, as humans refine AI-generated annotations, the Knowledge Layer grows more reliable and relevant. Compared to manually cataloging and maintaining metadata, this approach reduces time and effort by a factor of over 10. It maintains a continuously improving semantic model that aligns with evolving business understanding.
Summary
The Knowledge Layer organizes and contextualizes all analytics assets into a flexible graph-based structure. It unites machine-driven inference with human validation to produce a reliable semantic fabric. This structured, AI-assisted environment makes it possible for Numbers Station to answer complex questions accurately, trace analytics lineage, and provide a consistent, navigable representation of your organization's data and insights.
